SERPView vs StatPecker
Side-by-side comparison to help you choose the right tool.

SERPView
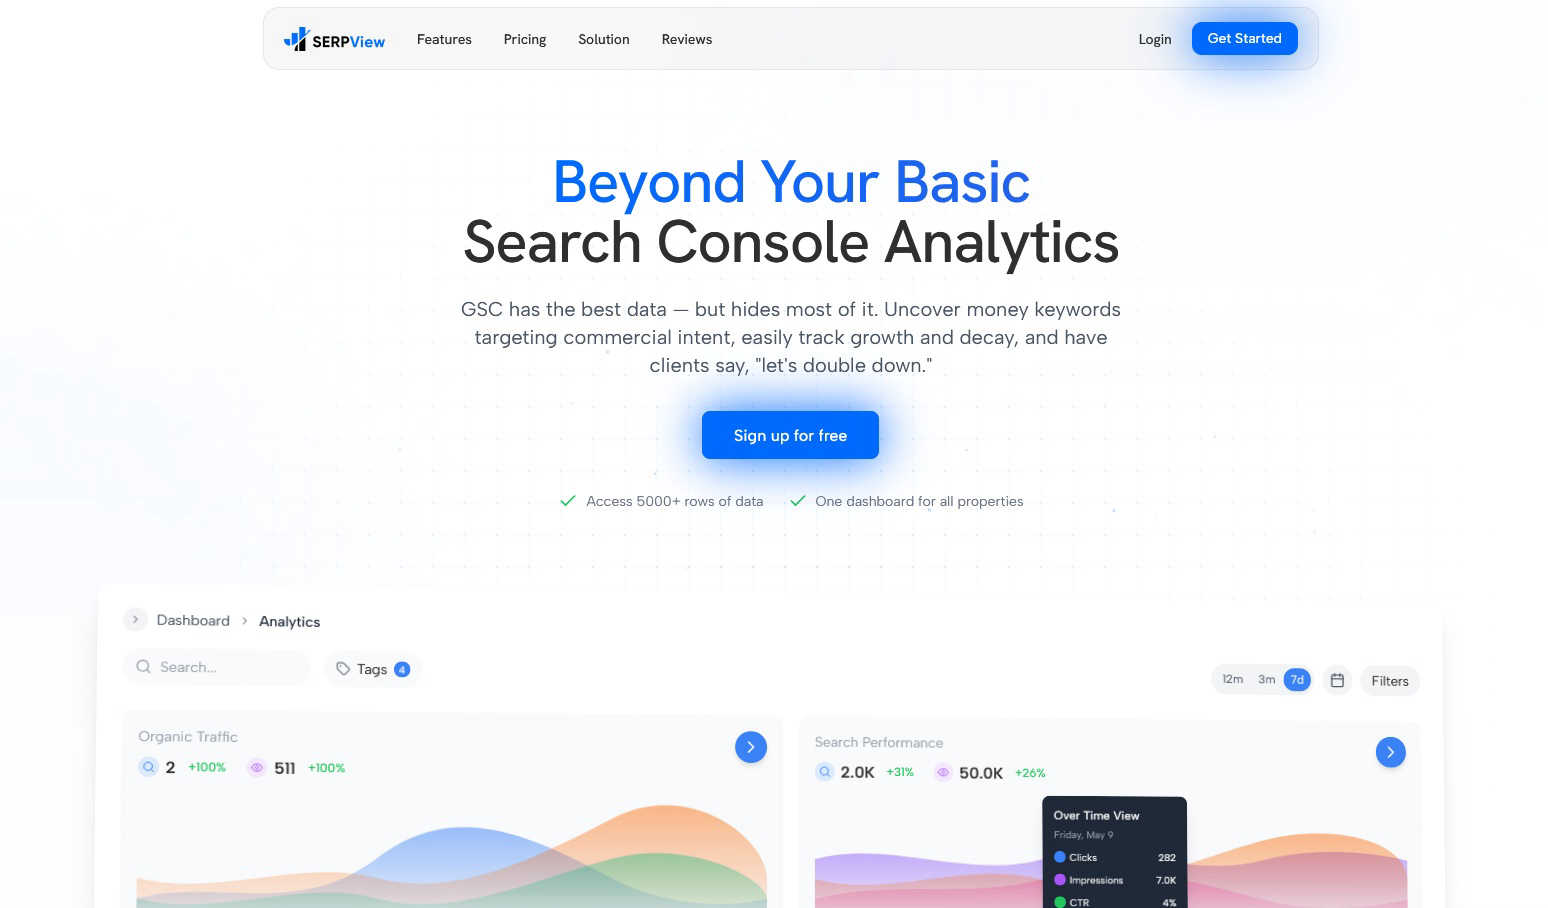
SERPView transforms Google Search Console data into a powerful, limitless SEO dashboard for deeper insights and.
Last updated: March 1, 2026

StatPecker
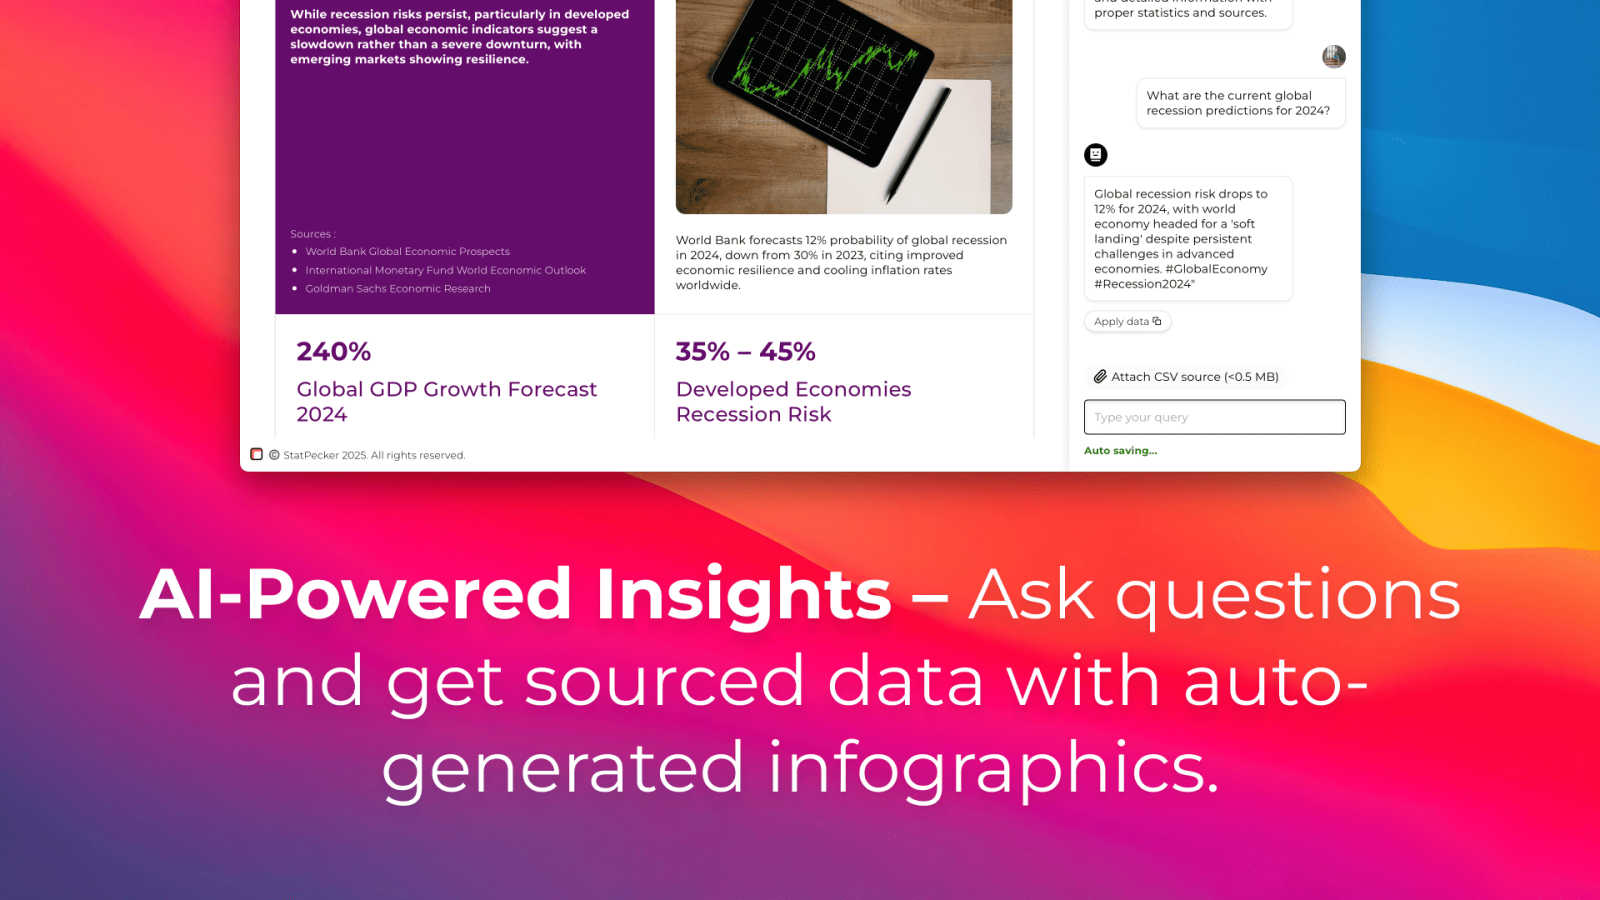
StatPecker transforms your data into secure, stunning visuals for instant business insights and content.
Last updated: March 1, 2026
Visual Comparison
SERPView
StatPecker
Feature Comparison
SERPView
Performance Tracking
SERPView offers unparalleled performance tracking by allowing access to up to 50,000 rows of GSC data, in stark contrast to GSC's 1,000-row limitation. Users can seamlessly monitor metrics such as clicks, impressions, CTR, and average position, without the constraints that typically hinder comprehensive analysis.
Keyword Analysis
This feature empowers users to discover high-value keywords that demonstrate commercial intent. SERPView allows for detailed tracking of keyword performance over time, enabling users to identify new opportunities and understand how their keyword rankings fluctuate, thus optimizing their content strategies.
Page Analysis
With SERPView, users can conduct thorough analyses of page performance within search results. This feature highlights which pages are succeeding and identifies underperforming content, offering insights into optimization opportunities that can help enhance overall site performance.
Mobile vs Desktop Analysis
SERPView provides a comparative analysis between mobile and desktop performance, enabling users to discern how different device types interact with their content. This feature helps identify specific optimization opportunities tailored to mobile or desktop users, ultimately improving search rankings and user experience.
StatPecker
AI-Powered Query Insights
Simply ask a question in plain language, and StatPecker's AI engine will generate instant insights by pulling from validated data sources. This feature removes the complexity of traditional data analysis tools, allowing users to get credible answers and visualizations without needing to write code or navigate complicated software interfaces. It's designed for speed and simplicity, turning curiosity into clear, publishable visuals.
Local SQL Agent for Private CSV Analysis
This groundbreaking feature ensures complete data privacy and security. Users can upload CSV files up to 50 MB, and StatPecker's local agent processes everything directly on their device. It enables deep, private exploration of proprietary data through natural language questions, generating SQL queries and insights locally. The results are then presented as ready-to-share charts, all without the data ever leaving the user's computer.
Publish & Embed Interactive Visuals
StatPecker doesn't just create static images; it produces interactive infographics that can be seamlessly integrated into any digital content. Users can embed these dynamic visuals directly into blogs, articles, websites, or internal wikis. This feature enhances reader engagement by allowing audiences to interact with the data, and it maintains a professional, cohesive look across all publishing platforms.
Download & Export for Universal Use
For offline reports, presentations, or printed materials, StatPecker provides robust export capabilities. Users can download their created infographics as high-quality image files (like PNG or JPG) for use in slide decks, reports, social media, or marketing collateral. This ensures that the powerful visuals created within the platform can be utilized anywhere, maintaining flexibility across all communication mediums.
Use Cases
SERPView
SEO Campaign Optimization
SERPView is ideal for digital marketers looking to optimize their SEO campaigns. By leveraging the platform's comprehensive analytics, users can identify key areas for improvement, track keyword performance, and adjust strategies accordingly to maximize organic traffic growth.
Content Strategy Development
For content strategists, SERPView serves as a vital resource for developing and refining content strategies. The platform's insights allow users to discern which topics are resonating with audiences and which content requires enhancement, ensuring that efforts are aligned with user interests and search trends.
Competitive Analysis
SERPView can aid businesses in conducting competitive analysis by providing insights into how their performance stacks up against competitors. Users can track keyword rankings and identify gaps in their strategy, enabling them to refine their approach and gain a competitive edge in the digital landscape.
International SEO Management
For organizations with a global presence, SERPView facilitates effective international SEO management. The platform allows users to monitor performance across various countries and languages, providing the data necessary to adapt strategies for different markets and optimize global outreach.
StatPecker
Content Creation & Blogging
Bloggers, journalists, and digital content creators use StatPecker to quickly find and visualize data that supports their narratives. Instead of using generic or outdated charts, they can generate unique, interactive infographics that boost SEO, increase reader engagement, and establish authority by backing up claims with compelling, easy-to-understand visual evidence directly within their articles.
Business Intelligence & Reporting
Analysts and managers leverage the Local SQL Agent to analyze internal sales, marketing, or operational data stored in CSVs. They can ask specific questions like "Which regions drove the most revenue last quarter?" and instantly receive a professional chart for stakeholder presentations or internal reports, streamlining the weekly or monthly reporting cycle without compromising data security.
Marketing & Social Media Campaigns
Marketing teams utilize StatPecker to create eye-catching visuals for campaign reports, social media posts, and client dashboards. The ability to transform campaign metrics (engagement rates, conversion data) into stunning infographics helps in telling a success story more effectively, making performance reviews impactful and shareable across teams and with clients.
Education & Academic Instruction
Educators and trainers employ StatPecker to explain complex statistical concepts, historical trends, or scientific data to students. By transforming abstract numbers into interactive visual stories, it enhances comprehension and retention. Students can also use the tool to visualize their research data for projects and theses, making their findings more accessible and persuasive.
Overview
About SERPView
SERPView is an advanced analytics platform specifically designed to maximize the utility of your Google Search Console (GSC) data. It effectively overcomes the inherent limitations of the native GSC interface, transforming raw performance metrics into a cohesive, actionable dashboard for SEO insights. Targeting SEO professionals, digital marketers, and content strategists, SERPView allows users to delve deeper than standard reporting, facilitating profound analysis and strategic planning. The core value of SERPView lies in its ability to provide unrestricted access to over 50,000 rows of data—far exceeding GSC's restrictive 1,000-row cap—ensuring that no crucial keyword, webpage, or trend is overlooked. This platform acts as an indispensable tool for those committed to optimizing their organic search visibility, uncovering hidden opportunities, and leveraging data-driven insights to enhance rankings and drive sustainable traffic growth.
About StatPecker
StatPecker is a transformative AI-powered platform that fundamentally redefines the art and science of data visualization. It serves as a bridge between raw, complex data and compelling, actionable insights, automating the entire process of data storytelling. The tool is engineered to convert numerical information into stunning, interactive infographics and charts within seconds, eliminating the traditional barriers of technical expertise, expensive design software, and significant time investment. Its core value proposition lies in democratizing data communication, making it accessible and effective for a vast spectrum of users. From content creators seeking to enrich their blogs, to marketers crafting campaign reports, analysts presenting findings, and educators explaining complex trends, StatPecker empowers all to convey their message with clarity and impact. By handling the heavy lifting of design and analysis, it allows professionals to focus on strategic interpretation and creative narrative, thereby enhancing decision-making and engagement across any field. With its commitment to both powerful functionality and user-friendly operation, StatPecker stands as the ultimate solution for anyone aiming to make their data not just seen, but understood and remembered.
Frequently Asked Questions
SERPView FAQ
What kind of data can I access with SERPView?
SERPView provides access to a vast dataset from Google Search Console, including up to 50,000 rows of performance data, which encompasses clicks, impressions, CTR, and average position metrics, all without the limitations of GSC.
How does SERPView improve my SEO reporting?
By centralizing data across multiple GSC properties, SERPView streamlines SEO reporting. It transforms complex data sets into user-friendly dashboards that highlight critical insights, allowing for more strategic decision-making and efficient campaign management.
Can I compare performance across different devices with SERPView?
Yes, SERPView includes a mobile vs desktop analysis feature that enables users to compare performance metrics across device types. This functionality helps identify specific optimization opportunities for each user group, enhancing the overall user experience.
Is SERPView suitable for large enterprises?
Absolutely. SERPView is designed to cater to the needs of SEO professionals and digital marketers across various scales, from small businesses to large enterprises, providing robust analytics tools that can handle extensive datasets and complex reporting requirements.
StatPecker FAQ
How does StatPecker ensure the privacy of my uploaded CSV data?
StatPecker prioritizes data privacy through its Local SQL Agent feature. When you upload a CSV file, the entire analysis process—from data preparation and query generation to insight calculation—occurs locally on your own device. Your raw data never leaves your computer to be sent to external servers, ensuring that sensitive business or personal information remains completely private and secure by default.
What is included in the Free Tier?
The Free Tier offers a robust starting point with unlimited projects and the ability to create unlimited embeds (with manual edits). It includes 25 AI queries to ask questions and generate insights from public data, and allows for 10 CSV uploads to analyze private data using the Local SQL Agent. This plan is designed to let users fully explore the platform's core capabilities at no cost.
What does "Lifetime Access" mean for the paid plan?
The Lifetime Access plan is a one-time payment of $150 (often offered at a discount) that grants permanent access to StatPecker's full suite of features. This includes unlimited AI queries, unlimited CSV uploads, unlimited projects and embeds, and priority support for feature requests. It is not a subscription, so there are no recurring fees, and it comes with a 10-day money-back guarantee.
Can I edit the infographics after StatPecker generates them?
Yes, StatPecker provides flexibility for customization. While the AI generates the initial visual based on your query or data, the platform allows for manual edits on the embeds. You can adjust elements like colors, labels, and titles to better align with your brand guidelines or specific presentation needs before publishing or downloading the final graphic.
Alternatives
SERPView Alternatives
SERPView is a sophisticated analytics platform that specializes in transforming Google Search Console data into actionable SEO insights. As a tool designed for SEO professionals and digital marketers, it enhances the ability to analyze performance metrics beyond the limitations of the native GSC interface. Users often seek alternatives to SERPView due to various factors such as pricing constraints, specific feature requirements, or compatibility with existing platforms. When considering an alternative, it is essential to evaluate data access capabilities, analytical depth, user interface ease, and overall value that can elevate your SEO strategy. --- [{"question": "What is SERPView?", "answer": "SERPView is a next-generation analytics platform that unlocks the full potential of Google Search Console data for deeper SEO insights."},{"question": "Who is SERPView for?", "answer": "SERPView is designed for SEO professionals, digital marketers, and content strategists seeking to enhance their search performance analysis."},{"question": "Is SERPView free?", "answer": "SERPView is a premium tool and does not offer a free version."},{"question": "What are the main features of SERPView?", "answer": "The main features of SERPView include expanded data access, advanced keyword and page analysis, and a unified dashboard for tracking performance across multiple properties."}]
StatPecker Alternatives
StatPecker is a powerful AI-driven analytics and data visualization platform designed to transform complex datasets into compelling, interactive infographics with remarkable speed. It belongs to the modern category of tools that prioritize accessibility, allowing users from various backgrounds to generate insights and tell stories with data without needing deep technical expertise. Users often explore alternatives to a single solution for a variety of reasons. These can include specific budget constraints, the need for integrations with other business platforms, or requirements for more advanced or specialized analytical features not covered by a generalist tool. The search for the right fit is a natural part of selecting technology that aligns perfectly with an organization's evolving workflow and strategic goals. When evaluating alternatives in the data visualization and analytics space, key considerations should include the tool's ease of use, the depth of its analytical capabilities, collaboration features, and the flexibility of output formats. Security protocols for handling sensitive data and the overall value proposition relative to cost are also paramount. The ideal platform should not only visualize data but also integrate seamlessly into your existing ecosystem to empower informed decision-making.