AskCSV

About AskCSV
AskCSV is designed for individuals and businesses seeking an intuitive way to analyze CSV data. By leveraging advanced AI, users can effortlessly uncover insights, visualize data, and create reports, all while ensuring their information remains secure and private through browser-based processing.
AskCSV offers a straightforward pricing model, starting with a complimentary trial for new users. For more frequent analysis or advanced features, subscription tiers provide increasing benefits, including enhanced data capacity and priority support. Users upgrading unlock efficiency and deeper insights into their data workflows.
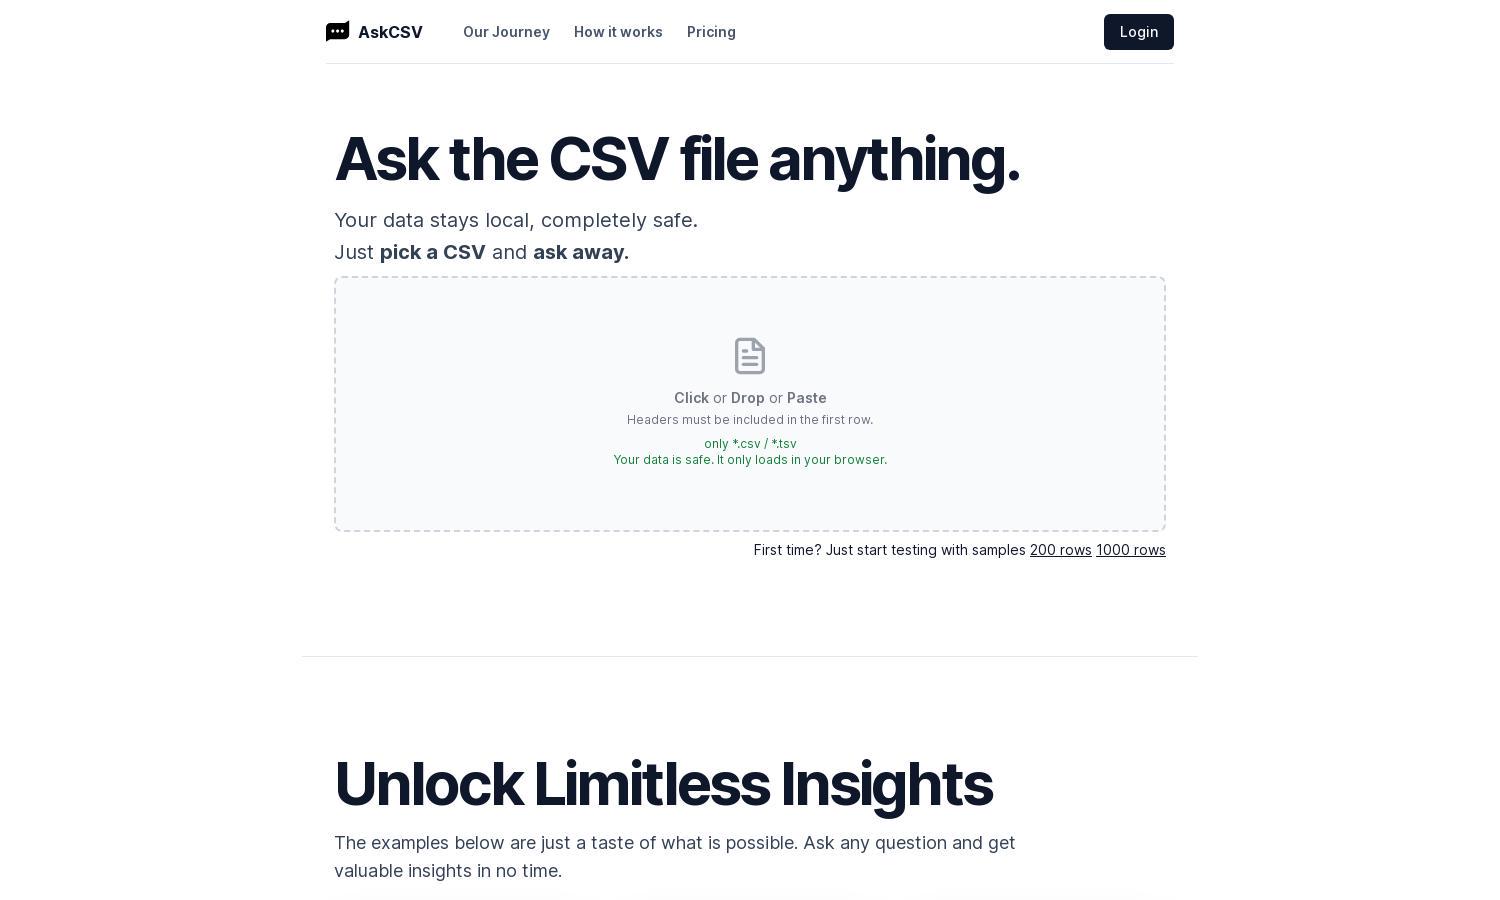
AskCSV features a user-friendly interface with a clean layout, ensuring smooth navigation and easy access to tools. Unique elements like drag-and-drop CSV uploads and intuitive chart suggestions enhance the user experience. The design promotes quick data analysis and visualization, streamlining the user's journey.
How AskCSV works
Users start by uploading their CSV files directly into AskCSV's platform. The first row must contain headers for accurate processing. After upload, the AI-powered tool can analyze, visualize, and respond to user inquiries about the data. The seamless interface allows effortless exploration of insights, making data analysis accessible to everyone.
Key Features for AskCSV
AI-Powered Insights
AskCSV's AI-powered insights enable users to extract valuable information from CSV data quickly. This unique functionality allows users to ask complex questions and receive instant, visual answers, streamlining their data analysis process and providing actionable insights effortlessly.
Secure Data Processing
AskCSV prioritizes user privacy by processing all data locally within the user's browser. This remarkable security feature ensures that sensitive information remains confidential, giving users peace of mind as they analyze CSV files without fear of data breaches or unauthorized access.
Visual Data Representations
The visual data representation feature in AskCSV allows users to convert complex data sets into easily digestible charts and graphs. This unique capability helps users quickly identify trends, patterns, and key metrics, enhancing comprehension and facilitating informed decision-making based on their data.


